Picture a creator your agency represents with two million YouTube subscribers. It is the number on every pitch deck, every rate card and every sponsorship negotiation. It is also, in the strictest sense, not theirs.
This article looks at that gap from the agency's side: how to size it across a roster, why it varies so much between creators, and what closes it. To keep it concrete we use the example roster from the jeruo demo workspace: 24 creators, 482,291 visitors and 71,420 captured leads over 90 days. The creators and their numbers are illustrative. The method works the same on your own roster.
A lease on attention
Your creators cannot email those two million people. They cannot call them, survey them, or tell them about a product launch. They can publish and hope the algorithm agrees. The subscriber count is a lease on attention, renewed at the platform's discretion, and the terms can change without notice.
Say the same creator has 20,000 email subscribers. That list is 1% of the channel, and it is the only part of the audience the agency actually controls.
For a single creator this is an abstract risk. It becomes concrete the first time a platform changes a policy, demonetizes a category or quietly reduces reach for links in descriptions. The creators who ride that out best are the ones who already own a direct line to a meaningful slice of their audience.
Sizing the exposure
For an agency managing twenty creators, the rented-to-owned gap is a balance-sheet item. The calculation is deliberately blunt:
- Rented reach: total followers and subscribers across every platform.
- Owned reach: email addresses and phone numbers with consent, held by you.
- Conversion ratio: owned divided by rented, per creator.
Run it across a roster and look at the spread rather than the average. The creators at the top of the list are often not the biggest ones. They are the ones who have been running a lead magnet consistently, month after month.
Try it on your own roster
Add up owned reach for your three largest creators and divide by their combined followers. If the answer is under 1%, the rest of this article is about you.
What an example roster shows
Below is the creator comparison screen from the demo workspace. Every row is one creator; the columns are the ones that matter for this argument: visitors, leads and the rate between them.
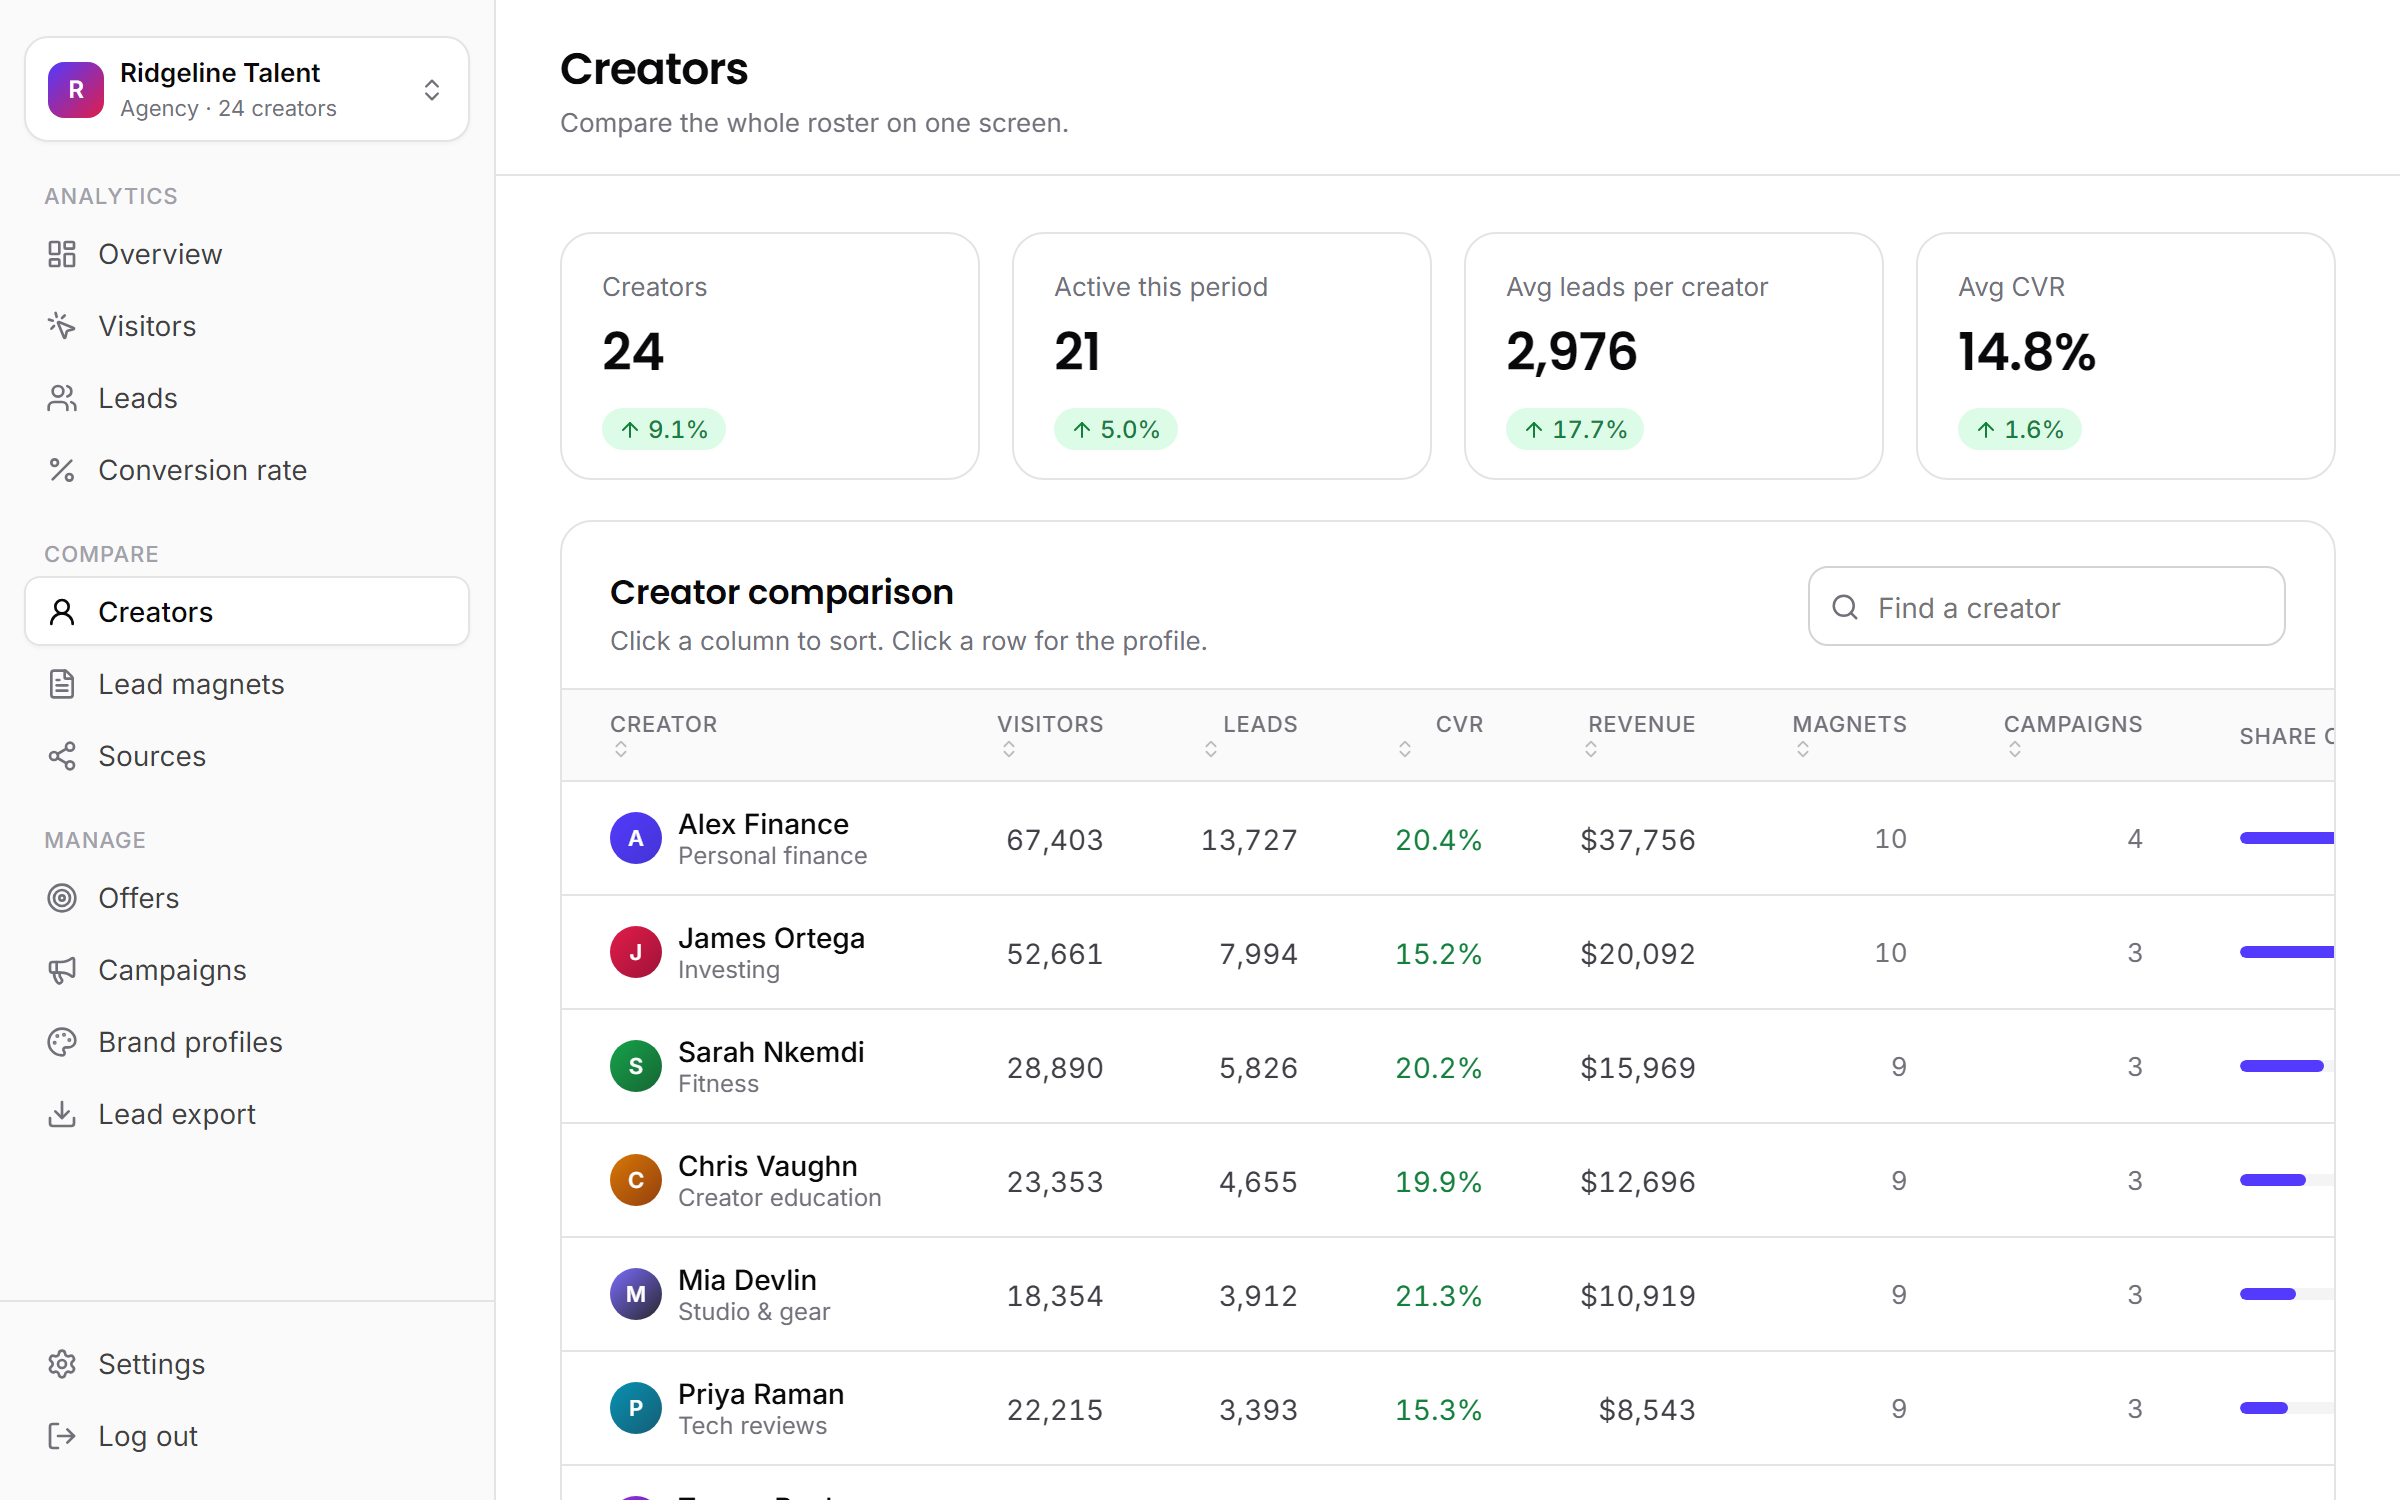
Pull five creators out of that list and the pattern is hard to miss:
| Creator | Niche | Visitors | Leads | Visit to lead |
|---|---|---|---|---|
| Alex Finance | Personal finance | 67,403 | 13,727 | 20.4% |
| James Ortega | Investing | 52,661 | 7,994 | 15.2% |
| Ben Ashworth | Productivity | 41,887 | 2,473 | 5.9% |
| Sarah Nkemdi | Fitness | 28,890 | 5,826 | 20.2% |
| Mia Devlin | Studio and gear | 18,354 | 3,912 | 21.3% |
Ben has the third-largest audience of the five and the lowest conversion rate. Mia has the smallest and converts best. If you ranked these creators by reach, you would put your effort in exactly the wrong place.
Why size does not predict conversion
Reach tells you how many people saw something. Conversion tells you how many of them wanted more. They measure different things, which is why they drift apart. A finance creator with a genuinely useful spreadsheet can out-convert a lifestyle channel ten times the size, because the offer matches the reason people showed up.
This is the argument for managing lead magnets at the portfolio level rather than per creator. When one creator's checklist converts at 24.8% and another's ebook converts at 6.3%, that is not a fact about the creators. It is knowledge that should travel across the roster, and it only can if all of it lives in one place.
Three habits that close the gap
Three habits do most of the work of turning rented reach into an owned audience.
1. Utility over inspiration
Templates, spreadsheets, checklists and databases tend to beat narrative ebooks. The viewer can predict exactly what they will get, so the decision to hand over an email is a small one.
2. Capture at the moment of interest
A link or QR code placed at the point in the video where the problem is being described gives the viewer a reason to act while they still care. Mention the same asset in the outro and the viewer who cared may already have gone.
3. One offer per surface
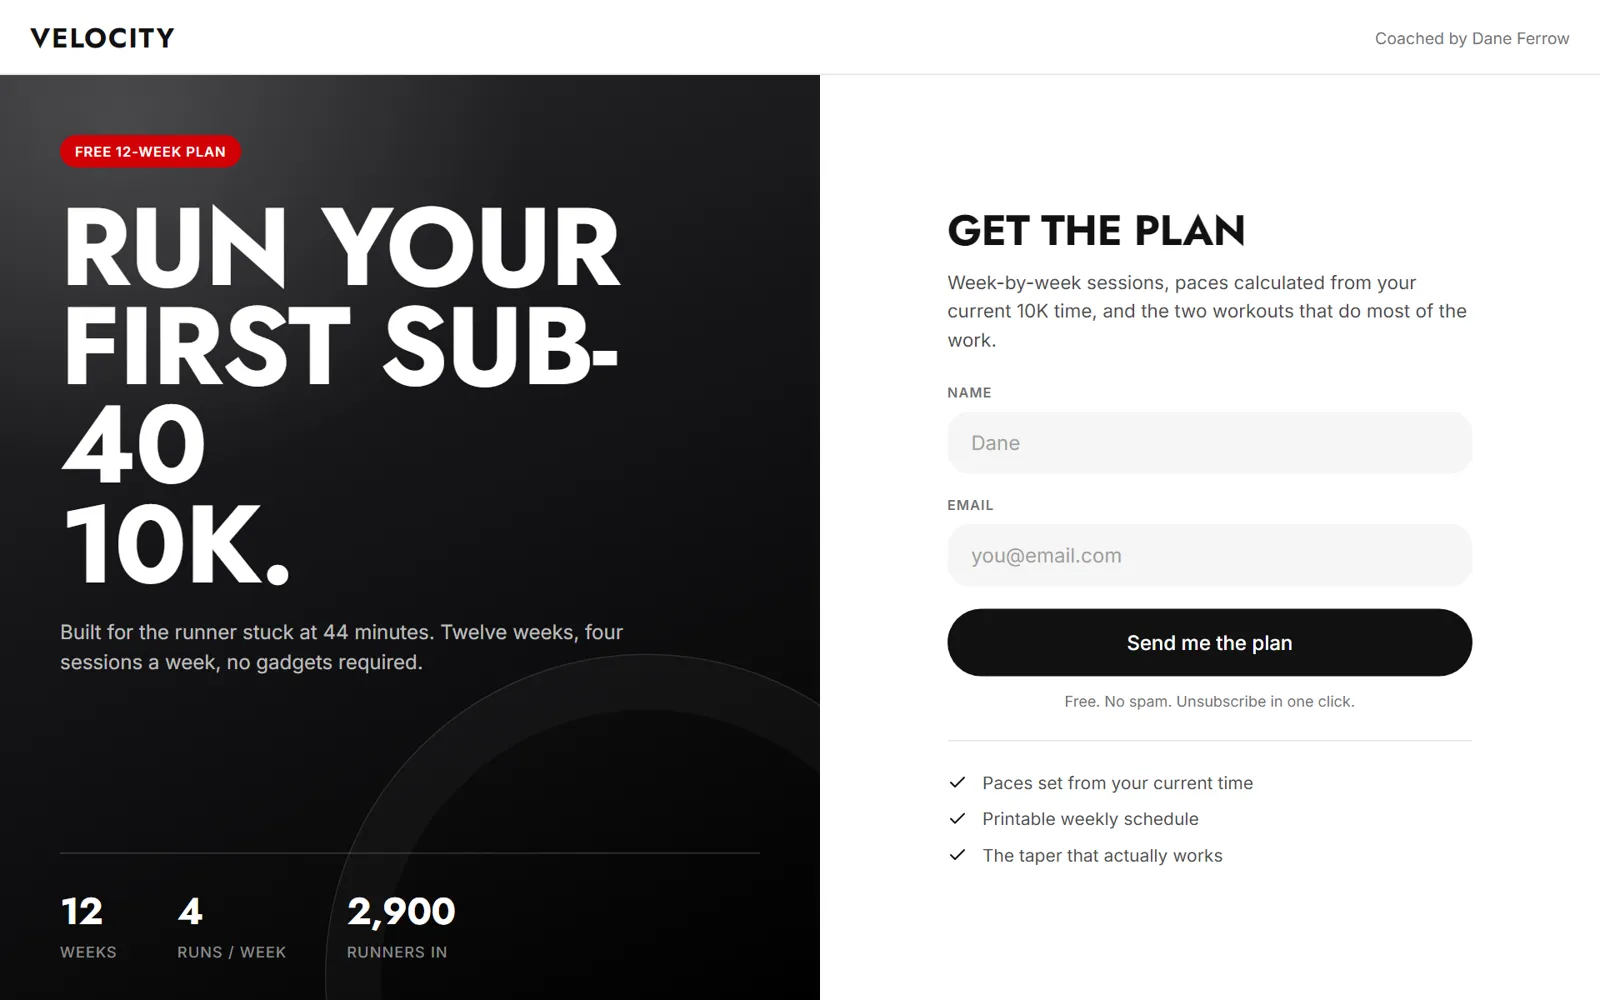
A description box with six links asks the viewer to choose; one link with a reason to click it does not. The same goes for the lead page itself: name and email, nothing more. Every extra field is one more reason to leave.
Where the leads come from
Once every link carries its source, the channel picture usually surprises people. In the demo workspace, YouTube delivers the most leads by volume, but it is not the channel that converts best.
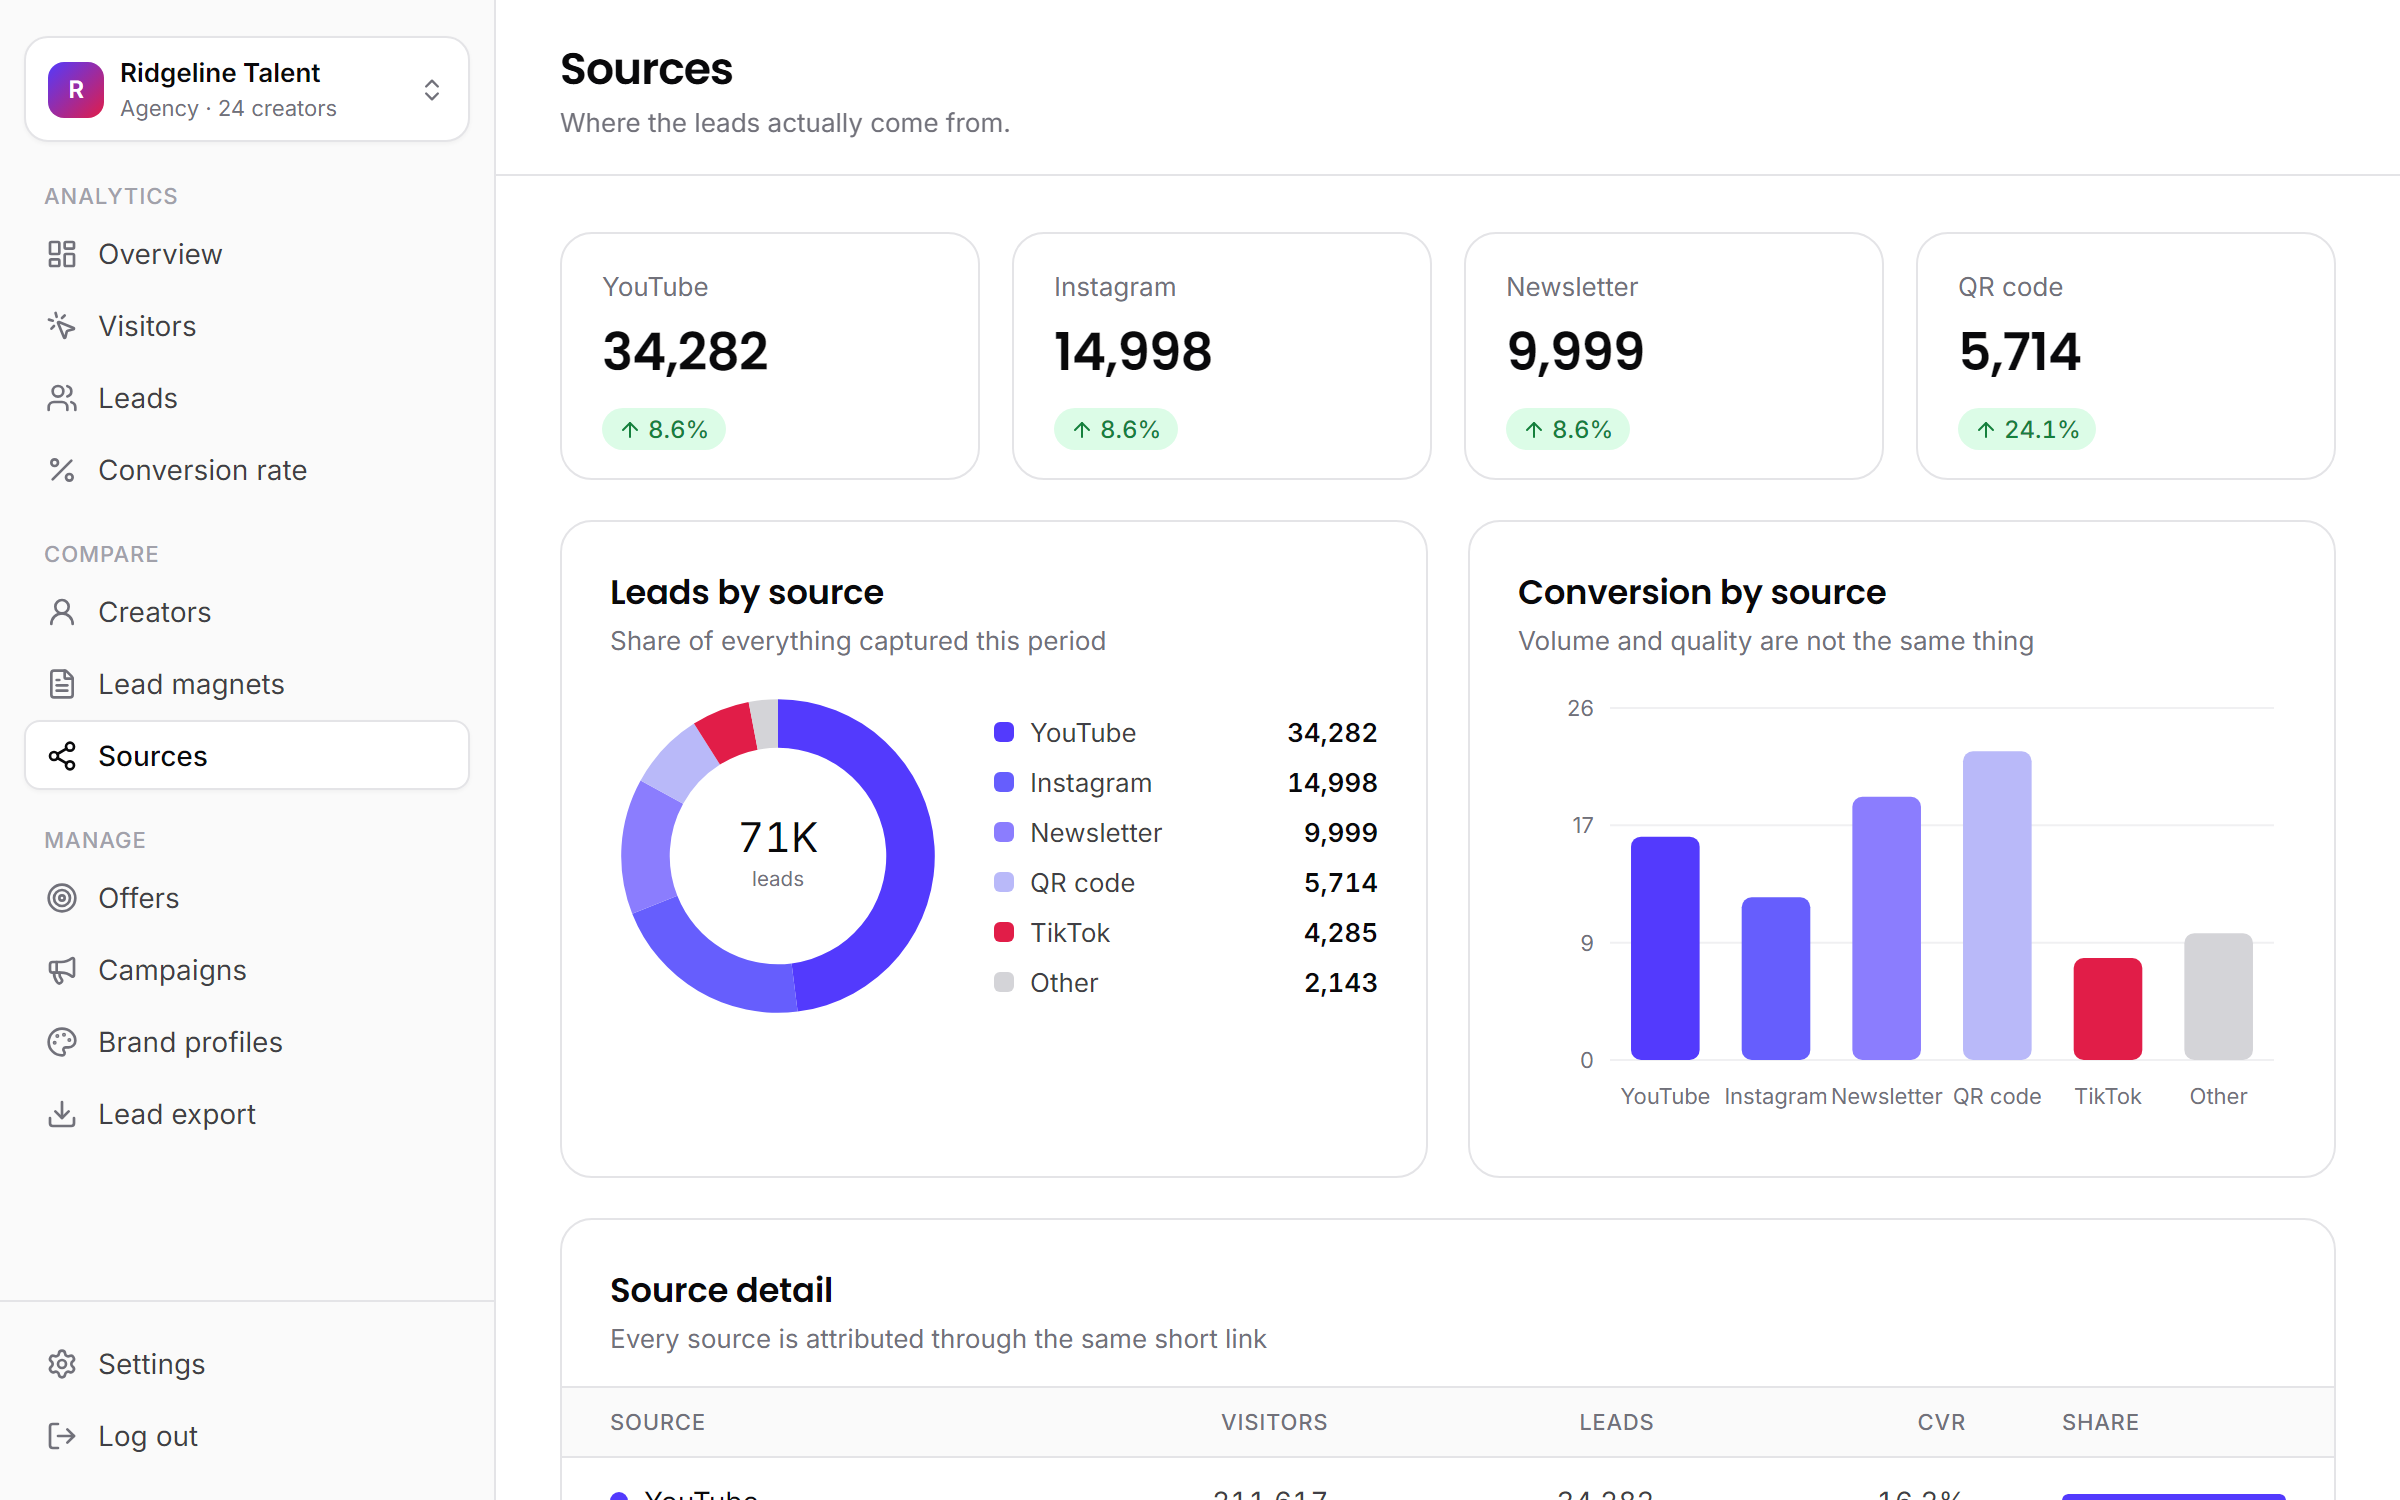
- QR codes: 22.4%. The smallest channel, and the best converter. Someone who picks up a phone mid-video has already decided.
- Newsletter: 19.1%. Warm readers who already trust the creator.
- YouTube: 16.2%. The volume engine, with half of all leads.
- Instagram: 11.8% and TikTok: 7.4%. Big reach, casual intent.
What to measure after
Once capture is running, the number that matters is not total leads. It is leads per thousand views, split by source. That is the metric that tells you whether a creator's audience is convertible at all, and the one that survives comparison across a portfolio where channels differ in size by two orders of magnitude.
Report it to clients monthly. A creator who can see their owned audience growing has a concrete reason to renew.
The short version
- Subscribers are rented. Emails are owned. Measure the ratio per creator.
- Your biggest creator is not necessarily your best converter, so do not rank by reach.
- Useful, specific lead magnets placed at the moment of interest close the gap.
- Track leads per thousand views by source, and put it in every client report.