Creators rarely leave an agency because of one bad month. They leave because they cannot see what the agency did in the good ones.
Most of what an agency does for a creator is invisible from the creator's chair. A sponsorship deal is visible because it arrives as an invoice. The lead magnet that was rewritten, the link moved from the outro to the first minute, the QR code added to a sponsored segment: none of that shows up anywhere the creator looks, unless someone puts it there.
This article covers the one-page monthly report that puts it there: what goes on it, what stays off, when to send it and how a read-only dashboard covers the weeks between. Numbers are from the jeruo demo workspace or hypothetical, and the method works with any data source.
Why reports decide renewals
The renewal conversation starts months before it happens. By the time a contract comes up, the creator has already formed a view, built from whatever they happened to remember: the deal that fell through, the week a message went unanswered, the month their numbers dipped. If the agency's wins are not written down anywhere, they are not part of that memory.
A monthly report changes what the creator remembers. Twelve reports make twelve dated records of what happened and what the agency did about it. At renewal, that record is on the table, and the conversation is about next year instead of about whether last year happened.
Timing matters as much as content. When a creator asks "what are you actually doing for me?", the answer is already late, because the question means they have been wondering for a while. The report's job is to answer that question every month, before anyone has to ask it.
What goes on the one page
One page, five blocks, in this order. If it does not fit on a page, something on it is not earning its place.
- Owned audience growth. The headline: how many email subscribers the creator owns, how many joined this month, and the change on last month. Everything else on the page explains this number.
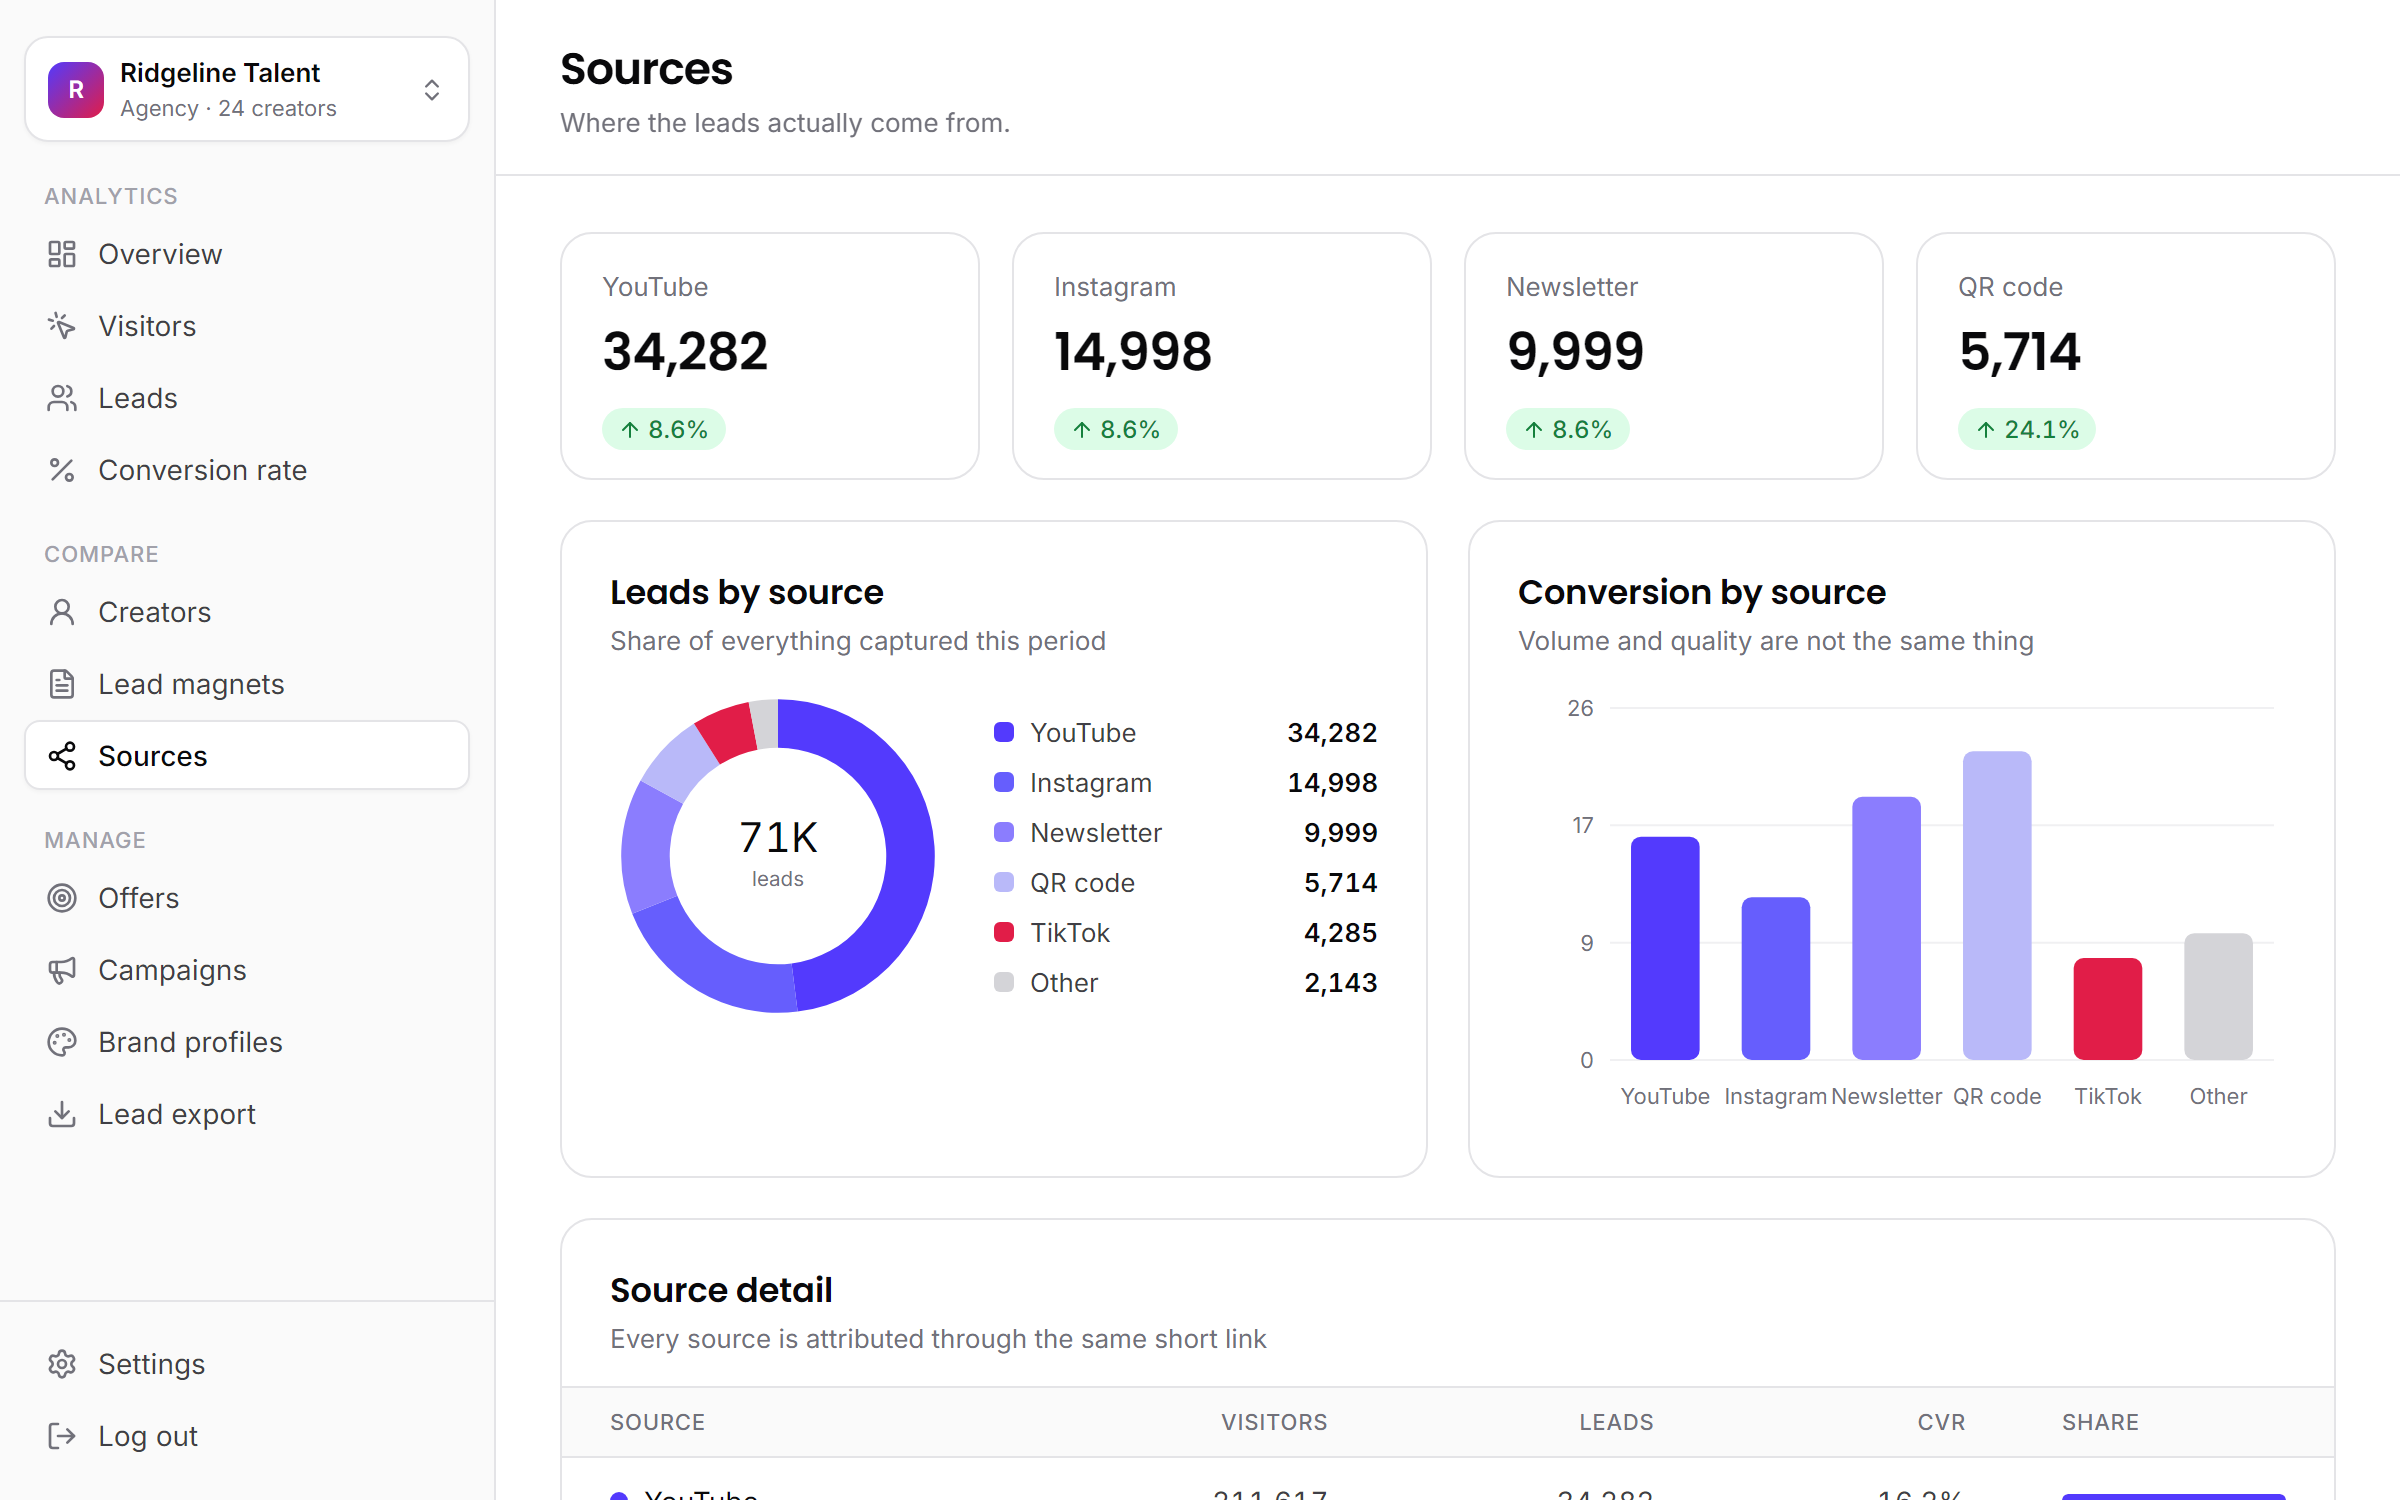
- Leads by source. Where the new subscribers came from (YouTube, newsletter, QR codes, Instagram, TikTok), with leads and visit-to-lead rate for each.
- Best placements. The three specific placements that brought in the most leads: the video, the pinned comment, the QR code in the gear review. Specific beats aggregate, because the creator remembers making that video.
- What changed. Two or three things the agency did this month, in plain sentences. "Moved the budget template link from the outro into the first two minutes of every finance video."
- What is next. One or two changes planned for next month, and anything you need from the creator to make them happen.
The first three blocks are data. The last two are the agency's voice. A report with only the first three is a dashboard export; with all five, it shows the creator what the agency did and why the numbers moved.
Keep block five honest about effort on both sides. "We need one 20-second mention of the template in next Tuesday's video" is a request the creator can say yes to. "Let's keep growing the list" is not a plan.
What to leave out
The temptation is to prove effort with volume. A twelve-page report says "we were busy", not "this worked". Leave out:
- Platform stats the creator already has. Views and watch time are one click away in their own analytics. The report's value is the part they cannot see anywhere else: the audience they own.
- Metrics without an outcome. Sessions, bounce rate and time on page are inputs. If a number does not connect to leads or revenue in one sentence, it belongs in your internal review, not the creator's report.
- Other creators' numbers. Comparing creators is a useful management tool inside the agency, as biggest creator, not best converter shows. In a client's report it starts an argument you do not need.
- Excuses. A weak month gets one line of cause in "what changed" and one line of response in "what is next".
What never gets left out is the bad month. The months where leads dipped are where reporting earns trust: here is what dropped, why we think it dropped and what we are changing.
Numbers a creator understands
Creators think in people and subscribers, not sessions and rates. Most of the work of a good report is translation.
| Analytics says | The report says |
|---|---|
| 14,200 sessions on the lead page | 14,200 visits to your page this month |
| QR code visit to lead: 22.4% | More than one in five people who scanned your QR code joined your list |
| TikTok visit to lead: 7.4% | About one in fourteen visitors from TikTok joined |
| Leads up 12% on previous period | 12% more new subscribers than last month |
| Top campaign by conversions | The video that brought in the most subscribers |
| Bounce rate: 61% | Leave it out |
The two rates come from the demo workspace; the other figures are hypothetical. Three rules make the translation stick.
Counts first, rates second. "2,140 new subscribers" means something on its own. A rate needs context, so it comes second, as the explanation. Reading conversion rates covers what a rate can and cannot tell you.
One comparison. This month against last month. Add more and the creator has to work out which one matters.
The creator's names for things. "Your budget template", not "LM-014". "The March gear review", not a campaign code.
Cadence: monthly, on the same day
Monthly is the right default. An owned audience grows over weeks, not days, so a weekly report is mostly noise and turns into busywork on both sides. Quarterly is too slow: a placement that stopped running in week one can cost three months of leads before anyone notices.
Send it on a fixed day and keep the day. The 1st works well because creators already think about money by the month: invoices, payouts, sponsorship calendars. Reliability does more for trust than polish. A plain report that lands on the 1st every month beats a beautiful one that arrives sometime in the first week.
Use the quarter for a conversation, not another document. Three monthly reports on the table, thirty minutes on a call, one decision about the next three months.
The dashboard between reports
The report is a record, sent on a schedule. Creators also have questions in between: how is Tuesday's video doing, did the newsletter mention work. A read-only client dashboard answers those without a message to the account manager.
In jeruo, each creator can get a private link to a dashboard that shows only their own numbers: visitors, leads, sources, top placements and, with revenue attribution, revenue. Nothing from the rest of the roster appears, and the link can be revoked at any time. Client dashboards and white-label reports both come with the Agency and Pro plans.
The two do different jobs, so do not let one replace the other. A dashboard has numbers but no story: it cannot say what the agency changed or what it plans next. The report carries the story. The dashboard keeps the creator from waiting a month to see whether the story is still true.
Sending it without the busywork
Reports usually die in the copy-paste week. Numbers come from the platform analytics, the link shortener, the email tool and a spreadsheet, get screenshotted into a template, then get checked again because two tools disagree about the same week.
The copy-paste week, in hours
Take a hypothetical agency with 15 creators. At two hours to assemble each report by hand, the first week of every month loses 30 hours before anyone writes a sentence about what to do next.
The fix is to build the report from the same data as the dashboard. The numbers then match what the account manager sees, nobody takes a screenshot, and the human time goes into the two blocks that need judgment.
That is how jeruo does it: a monthly report for each creator, built from the dashboard's data and laid out in the creator's colors and logo from their brand profile. Send it automatically on the 1st or share it yourself. A sensible split: automatic for creators who mostly want the numbers, and shared by hand with a three-line note on top for the relationships that need a voice. A demo is the quickest way to see one.
The short version
- Creators renew on what they remember. A monthly report decides what that is.
- One page: owned audience growth, leads by source, best placements, what changed and what is next.
- Translate rates into people, leave out vanity metrics and other creators' numbers, and report bad months honestly.
- Send it on the same day every month, built from the dashboard's data, with a read-only dashboard for the questions in between.